
How to Look Up Placer County Jail Population Data
Placer does not post a live dashboard with charts. The county uses PDF reports instead. The two key files are the In-Custody Report and the Daily Booking and Release Report. Both are linked from the Placer County View page at placer.ca.gov/3676/View and from the Sheriff's Our Jails page. The In-Custody Report is the live roster. It refreshes daily and lists every person held that day across the Auburn Jail and the South Placer Adult Correctional Facility. The 10 Day Arrest Log, also linked from the Sheriff's site, gives a recent flow of new bookings but does not give a stock count.
To pull a clean population number, count the rows on the current In-Custody PDF. The Sheriff's PDF does not break out race, sex, age, or charge type on the public version. Those slices come from outside sources. The Board of State and Community Corrections publishes a county jail profile at bscc.ca.gov. The Bureau of Justice Statistics publishes annual jail reports at bjs.ojp.gov. The Vera Institute Incarceration Trends tool at trends.vera.org shows multi-year county lines. The Placer County annual budget at placer.ca.gov/1620/Budget carries staffing and ADP notes in the Sheriff's section.
The Sheriff's Our Jails page is the public front door for jail data in Placer County, shown here from placer.ca.gov/2527/Our-Jails.
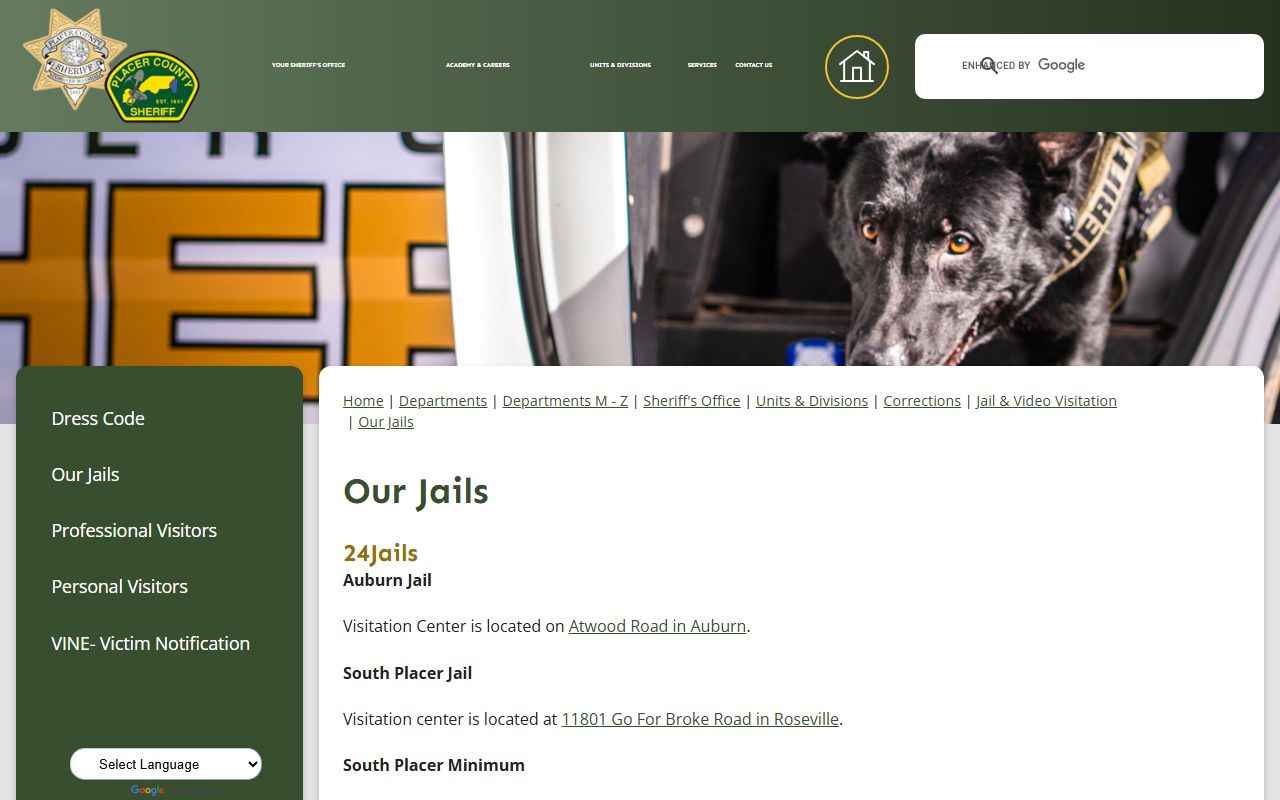
That page is where visitors and researchers pick up phone numbers, bail rules, and direct links into the live In-Custody Report.
Note: The Sheriff's In-Custody Report is the only daily roster source for Placer. Third-party jail sites are not official.
Placer County Jail Capacity Overview
Placer County runs two jail sites. The Auburn Jail at 2775 Richardson Drive opened in July 1985 at a build cost of $4.5 million, paid for through Proposition 4. The California State Board of Corrections rated the original structure for 108 beds. Demand blew past that number fast. The site hit 148 inmates within two months of opening and 272 by 1990. A 1990 federal court order then capped the daily count at 148 and forced new construction. The 1992 addition opened in April of that year at $3.5 million, funded by Propositions 52 and 96. It added 260 beds split into two 92-bed medium dorms, one 44-bed medium dorm, and one 32-bed maximum module. With the former minimum-security barracks online, total Auburn capacity reached 646 beds, six of them in the infirmary. The minimum-security barracks, built as a World War II Army warehouse in 1941, closed May 31, 2014, and inmates moved to South Placer.
South Placer Jail at 11801 Go For Broke Road in Roseville is the modern custody hub. County planning documents reference a full-buildout rated capacity of 980 beds, plus a five-year average length of stay of 16 days for the local system. The current open and operational bed count for South Placer should be confirmed from the live Placer County budget or the BSCC jail profile before any final headline figure is used.
| Facility | Rated Capacity | Status / Source |
|---|---|---|
| Auburn Jail, original 1985 structure | 108 | Board of Corrections rating; quickly exceeded. |
| Auburn Jail, 1992 addition | 260 | 92 + 92 + 44 medium dorms, plus 32-bed max module. |
| Auburn Jail, full historical total with barracks | 646 | Includes six infirmary beds; barracks closed 2014-05-31. |
| Former Auburn minimum-security barracks | 160 | Closed May 31, 2014; inmates moved to South Placer. |
| South Placer Jail, full buildout | 980 | County planning snippet; verify current open beds in budget. |
The history shows a county that hit a hard cap in 1990 and built its way out twice. The cap is gone, but the design constraints from that era still shape how Placer assigns beds between Auburn and Roseville.
Average Daily Population
Average daily population, or ADP, is the mean head count across all days in a year. It is the single best measure of how full a jail runs. For Placer County, the current ADP is not posted on the Sheriff's public pages. The In-Custody Report is a daily snapshot, not a yearly mean. To pull ADP for Placer, use the Board of State and Community Corrections county jail profile at bscc.ca.gov, the BJS Annual Survey of Jails at bjs.ojp.gov, or the Sheriff's section of the Placer County budget at placer.ca.gov/1620/Budget.
One local planning input is in the public record. A Placer County planning snippet lists a five-year average length of stay of 16 days. Length of stay matters because it ties bookings to ADP. If a county books a lot of people but holds each one for only a few days, ADP stays low. If hold times stretch out, ADP climbs even when bookings are flat. A 16-day mean stay is short by California county standards, which lines up with Placer's mix of misdemeanor and pretrial holds rather than long sentenced stays.
Current ADP is a research gap on the public Sheriff site. Pull it from the BSCC jail profile.
Demographic Breakdown
The In-Custody Report does not publish demographic totals. It lists each person, not group counts. For race, sex, and age slices of the Placer County jail population, the working sources are the Vera Institute Incarceration Trends tool at trends.vera.org, the BJS Census of Jails, and the BSCC quarterly jail profile. Vera covers county jail population, jail incarceration rate, race breakdown, and pretrial share by year. BJS covers national and state-level patterns plus a sample of counties. BSCC covers California-specific monthly counts.
The county's own posted reports do not carry race or sex columns on the public PDFs. Citing a percentage without a current source would be a guess. Load the Vera county page for Placer or the latest BSCC profile for the live rows.
| Group | Source for current share |
|---|---|
| Male | BSCC quarterly jail profile, Placer. |
| Female | BSCC quarterly jail profile, Placer. |
| White, non-Hispanic | Vera Incarceration Trends, Placer County. |
| Hispanic / Latino | Vera Incarceration Trends, Placer County. |
| Black, non-Hispanic | Vera Incarceration Trends, Placer County. |
| Asian / Pacific Islander | Vera Incarceration Trends, Placer County. |
| Native American | Vera Incarceration Trends, Placer County. |
| Age groups | BJS Census of Jails county sample. |
The lack of a single posted breakdown is common for smaller California counties. Placer is not unique here. The fix is to keep the demographic view sourced to BSCC and Vera, not to the Sheriff's PDF.
Pretrial vs Sentenced Population
Pretrial inmates are people in jail waiting for trial or for a case to close. They have not been found guilty. Sentenced inmates are people serving a jail term after conviction. The split between the two groups is one of the most-watched jail numbers in California. After 2011 realignment, county jails took on more people serving felony time who would have gone to state prison in the old system. That tends to push up the sentenced share.
Placer's split is not posted on the Sheriff's site. The BSCC monthly jail profile carries a pretrial felony, pretrial misdemeanor, sentenced felony, and sentenced misdemeanor breakdown for every California county. That profile is the cleanest source for the live ratio. Vera also tracks a pretrial share line for Placer over time.
| Status | Source for current Placer share |
|---|---|
| Pretrial, felony | BSCC monthly jail profile. |
| Pretrial, misdemeanor | BSCC monthly jail profile. |
| Sentenced, felony (PC 1170(h)) | BSCC monthly jail profile. |
| Sentenced, misdemeanor | BSCC monthly jail profile. |
| Pretrial share over time | Vera Incarceration Trends, Placer County. |
A short length of stay, like the 16-day average noted in county planning, points toward a population heavy with pretrial and short-sentence inmates. Long-sentence post-realignment cases pull that mean up.
Misdemeanor vs Felony Population
The misdemeanor and felony split lines up with the pretrial and sentenced split but is not the same cut. A person can be held on a felony charge before trial and never be convicted. A person can serve a long sentenced term on a felony under Penal Code 1170(h) realignment. The BSCC jail profile breaks Placer's daily count into those four cells. The Sheriff's 10 Day Arrest Log shows the charge code on each booking, including Penal Code 978.5 bench warrant entries and outside agency warrant holds. But the arrest log is a flow, not a stock count.
Statewide, county jail populations in California skew toward felony holds because most misdemeanor cases are cited and released or resolved with short stays. The 16-day average stay supports a Placer mix that turns over quickly on misdemeanor holds while keeping a steadier sentenced felony group at South Placer.
Mental Health and Medical Population
Placer's Auburn Jail includes six infirmary beds inside its 646-bed historical total. Beyond that, no public Sheriff page breaks out the share of inmates getting mental health care or active medical care. The Placer County Health and Human Services Department runs jail behavioral health under contract. The BSCC publishes a quarterly "Mental Health Beds" line for California county jails.
Placer also operates specialty court calendars that pull people out of jail into treatment, including a Recovery Court, Mental Health Court, and Veterans Court. Those programs reduce the jail mental health load but do not zero it out. The current Placer mental health and medical population should be pulled from the BSCC jail profile. The Auburn infirmary count of six beds is the only fixed medical figure in the public record.
National and State Context
To know whether a jail count is high or low, the rate per 100,000 residents is the right yardstick. The Bureau of Justice Statistics publishes that rate at the national level each year in its Jail Inmates report. The Vera Institute publishes the same rate at the county level. California's overall jail incarceration rate runs below the national average. Placer's rate sits inside the California band, and the county lines up with mid-size suburban counties in Vera's data set.
| Level | Jail Population per 100k (source) |
|---|---|
| Placer County | See Vera Incarceration Trends for current Placer rate. |
| California statewide | See BSCC annual jail report. |
| National | See BJS Jail Inmates annual report. |
The reason this page does not lock in a single number for each row is simple. Jail rates move year to year. The BJS and Vera links above carry the current figure and the methodology behind it. Cite those sources, not a static value in a static page.
Population Trends Over Time
The Placer County jail population has been shaped by four big events. The first was the Auburn Jail opening in July 1985 at a rated count of 108. The second was the 1990 federal court order capping the daily count at 148 after the site reached 272. The third was the April 1992 expansion that added 260 beds. The fourth was the closure of the Auburn minimum-security barracks on May 31, 2014, when 160 minimum-custody inmates moved to South Placer. That shift was the start of South Placer's role as the main holding site.
The Placer County View page is the official county portal for jail data and recent custody reports, and is shown here from placer.ca.gov/3676/View.

The View page is where the multi-year trend can be tracked file by file. Each daily PDF is a single data point. For a longer view, Vera Incarceration Trends carries county annual counts going back decades. The local 16-day average length of stay points to a trend driven by booking volume more than by sentence length.
Note: Population counts can swing inside a single week when court calendars produce a wave of sentencings or releases.
Searching for Placer County Inmate Records by Name
This page covers aggregate jail population data, not person-level lookups. For a name search on the live jail roster, go to Placer County inmate records. That page covers the In-Custody Report, the Auburn and South Placer phone lines, and the 10 Day Arrest Log fields.
Where the Data Comes From
Five source streams feed the Placer County jail population picture. The Sheriff's PDFs give the live daily count. The county budget gives funded bed count and Sheriff staffing. The BSCC profile gives monthly pretrial, sentenced, felony, misdemeanor, and mental health splits. BJS gives national context and a county sample. Vera Incarceration Trends gives county time-series and rate-per-100k lines.
- Placer County Sheriff In-Custody Report and 10 Day Arrest Log, linked from placer.ca.gov/2527/Our-Jails.
- Placer County View page with Daily Booking and Release Report at placer.ca.gov/3676/View.
- Board of State and Community Corrections jail profile, bscc.ca.gov.
- Bureau of Justice Statistics jail reports, bjs.ojp.gov.
- Vera Institute Incarceration Trends, trends.vera.org.
- Placer County budget, placer.ca.gov/1620/Budget.
None of these are aggregator sites. A clean Placer County jail population number on any given week should trace back to one of these six links.